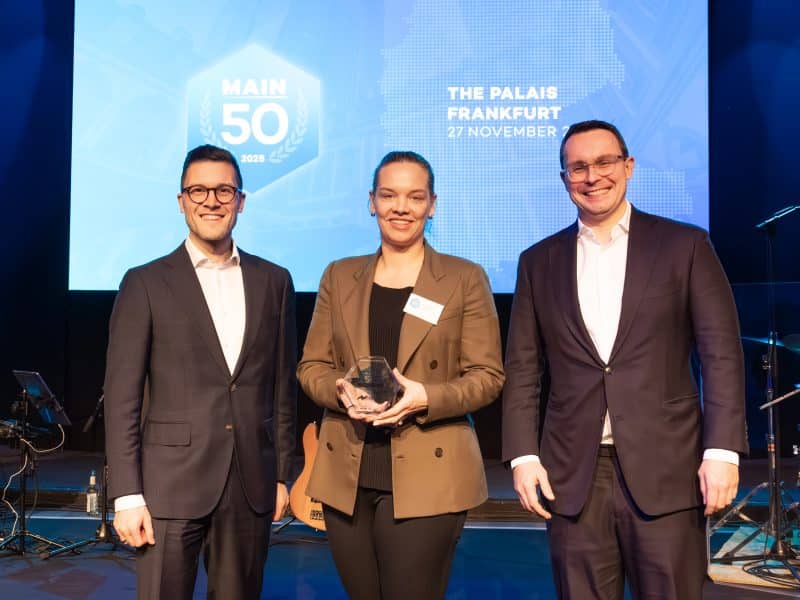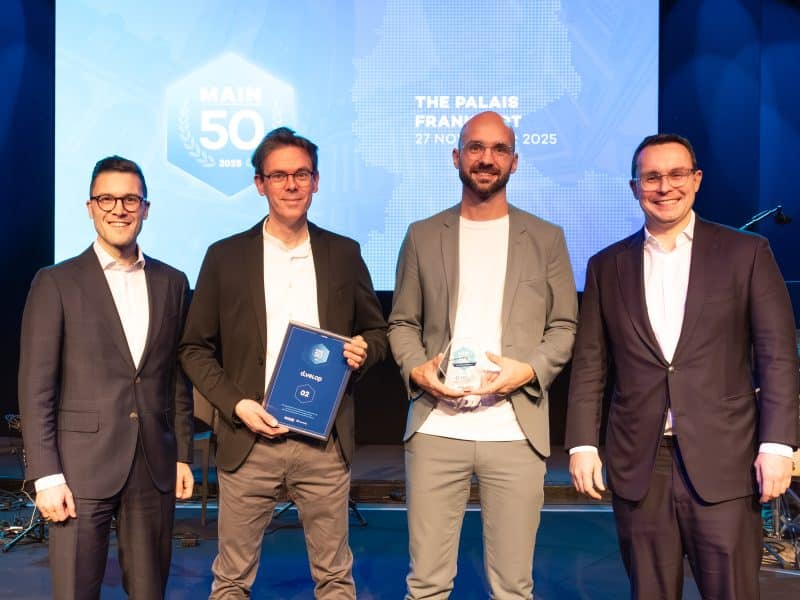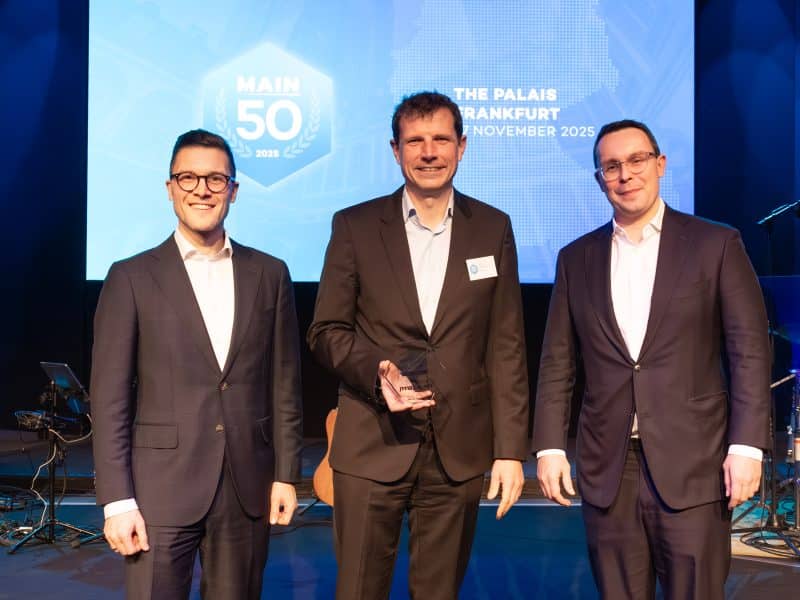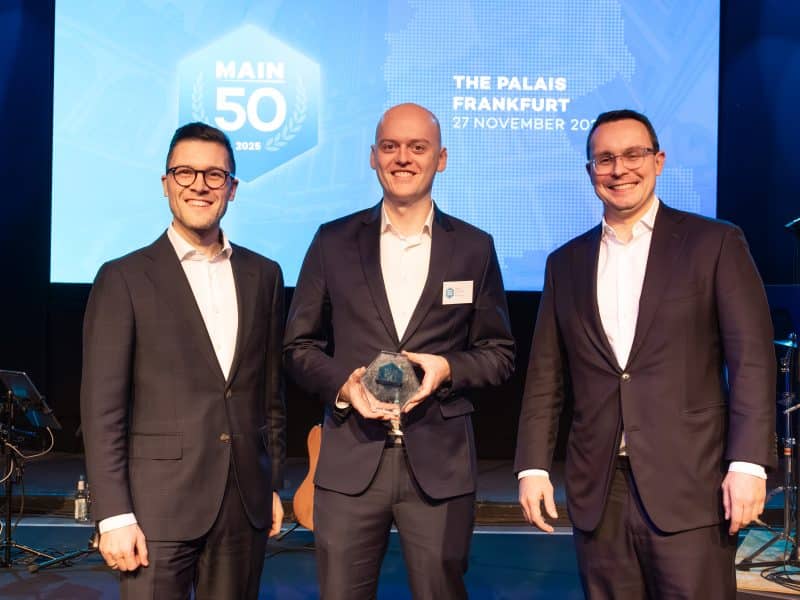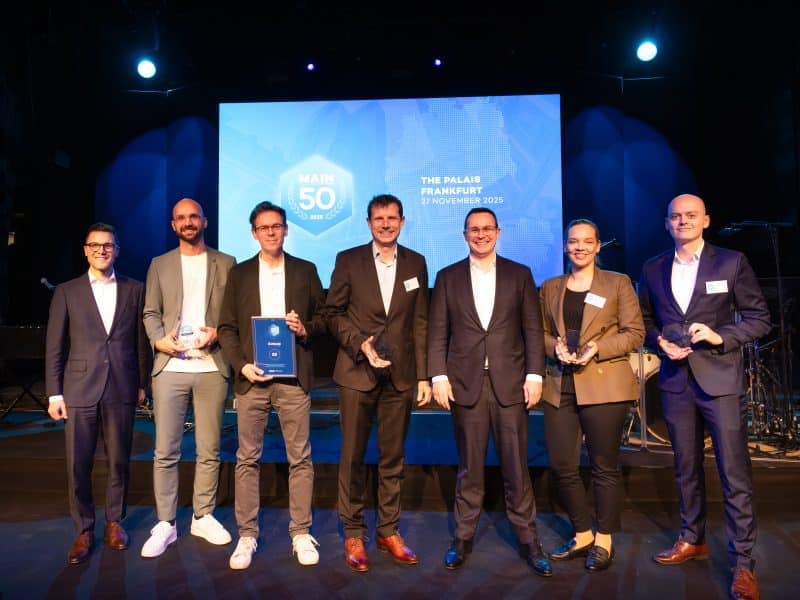
Wir zeichneten die Procilon GmbH, die d.elop AG und die NFON AG mit den Overall Champion Awards aus. ESG Software GmbH / CLIMCYCLE erhielt außerdem den Cloud Champion Award und die Hivebuy erhielt den Highest Growth Award.
| # | Name | Sektor | Score | Gründungsjahr | Standort |
|---|---|---|---|---|---|
| 1 |
Procilon Group |
Security Software |
100,0 |
2011 |
Deutschland |
| 2 |
d.velop AG |
Digital Contract Management |
99,4 |
1992 |
Deutschland |
| 3 |
NFON AG |
Business Communication Software |
95,6 |
1986 |
Deutschland |
| 4 |
Onventis Group |
Spend Management Software |
94,8 |
1999 |
Deutschland |
| 5 |
BITE GmbH |
Human Resource Management | 94,4 |
2004 |
Deutschland |
| 6 |
PERBILITY GmbH |
Human Resource Management |
94,1 |
2009 |
Deutschland |
| 7 |
ESG Software GmbH CLIMCYCLE |
ESG Management Software |
93,8 |
2022 |
Österreich |
| 8 |
cleversoft group GmbH |
Legal- and Regtech & Integrated Risk Management Software |
93,4 |
2004 |
Deutschland |
| 9 |
BMD Systemhaus GmbH |
Enterprise Resource Planning |
90,0 |
1972 |
Österreich |
| 10 |
ISEC7 Group AG |
Security Software |
89,9 |
2003 | Deutschland |
| 11 |
cisbox Holding GmbH |
Financial-Administrative Software | 89,8 | 2005 | Deutschland |
| 12 |
PICTURE GMbH |
Business Transformation Software |
89,3 |
2008 |
Deutschland |
| 13 | ASAPIO GmbH | Integration Software |
88,5 |
2006 | Deutschland |
| 14 | ARTEMEON Management Partner GmbH | Integrated Risk Management |
88,0 |
2008 |
Deutschland |
| 15 |
CI HUB GmbH |
Enterprise Information Management |
88,0 |
2018 | Deutschland |
| 16 |
LetMeShip - ITA Group |
Logistics Software |
87,6 |
2000 |
Deutschland |
| 17 |
Compart GmbH |
Enterprise Information Management |
85,4 |
1994 | Deutschland |
| 18 |
VOQUZ Labs GmbH |
Software Asset Management | 85,1 |
2021 |
Deutschland |
| 19 |
Softengine GmbH |
Enterprise Resource Planning | 84,7 | 1994 | Deutschland |
| 20 |
deltra Business Software GmbH |
Enterprise Resource Planning |
84,6 |
1995 |
Deutschland |
| 21 |
Aufinity Group |
Automotive Software | 84,5 |
2018 |
Deutschland |
| 22 |
WIANCO OTT Robotics GmbH |
Business Transformation Software | 84,5 |
2019 |
Deutschland |
| 23 |
Squirro AG |
Business Intelligence & AI |
83,7 |
2012 |
Schweiz |
| 24 |
Tigerlab Holding AG |
Banking & Insurance Software |
83,6 |
2008 |
Schweiz |
| 25 | synetics GmbH | IT Asset Management Software |
83,2 |
1998 |
Deutschland |
| 26 |
windata GmbH & Co. KG |
Payment Software | 82,7 |
1993 |
Deutschland |
| 27 |
FOCONIS GmbH |
Banking & Insurance Software | 82,6 |
2000 |
Deutschland |
| 28 |
engomo GmbH |
Low-code Platforms | 82,5 |
2012 |
Deutschland |
| 29 |
ADCELL | Firstlead GmbH |
Marketing & Sales Software | 82,2 |
2003 |
Deutschland |
| 30 |
oraïse |
Banking & Insurance Software |
82,2 |
1994 |
Schweiz |
| 31 | Reybex Cloud ERP | Enterprise Resource Planning | 81,5 |
2014 |
Deutschland |
| 32 |
TimeTool AG |
Human Resource Management | 81,4 | 1993 | Schweiz |
| 33 |
FunctionHR |
Human Resource Management | 81,4 |
2016 |
Deutschland |
| 34 |
POS Solutions GmbH |
Security Software |
81,2 |
2009 |
Österreich |
| 35 |
GIP (Kidicap) GmbH |
Human Resource Management | 81,0 |
1996 |
Deutschland |
| 36 | ivoflow GmbH | Spend Management Software | 79,6 |
2020 |
Deutschland |
| 37 |
uhb Software GmbH |
Healthcare Software |
79,1 |
1998 |
Deutschland |
| 38 | officeatwork | Enterprise Information Management |
78,4 |
1975 |
Schweiz |
| 39 |
DextraData GmbH |
Integrated Risk Management |
77,7 |
1995 |
Deutschland |
| 40 |
Modell Aachen GmbH |
Integrated Risk Management |
76,9 |
2009 |
Deutschland |
| 41 |
SoftProject GmbH |
Business Transformation Software |
76,3 |
2000 |
Deutschland |
| 42 |
Buchner & Partner GmbH |
Healthcare Software |
76,3 |
1991 |
Deutschland |
| 43 |
Eqip AG |
Human Resource Management |
76,3 |
2017 |
Schweiz |
| 44 |
syniotec GmbH |
Construction Software |
76,1 |
2018 |
Deutschland |
| 45 | medicalvalues GmbH |
Healthcare Software |
76,0 |
2021 |
Deutschland |
| 46 |
SOFTBAUWARE GmbH |
Enterprise Resource Planning |
75,9 |
1993 |
Deutschland |
| 47 |
MACH Holding GmbH |
Government Software |
75,8 |
1985 |
Deutschland |
| 48 |
qbees GmbH |
Banking & Insurance Software |
75,2 |
2020 |
Deutschland |
| 49 |
COMAN SoftwareGmbH |
Business Transformation Software |
74,9 |
1996 |
Deutschland |
| 50 |
HYPE Innovation |
Business Transformation Software | 74,8 |
2001 |
Deutschland |
Kontrolliert für aktive F&E-Kosten
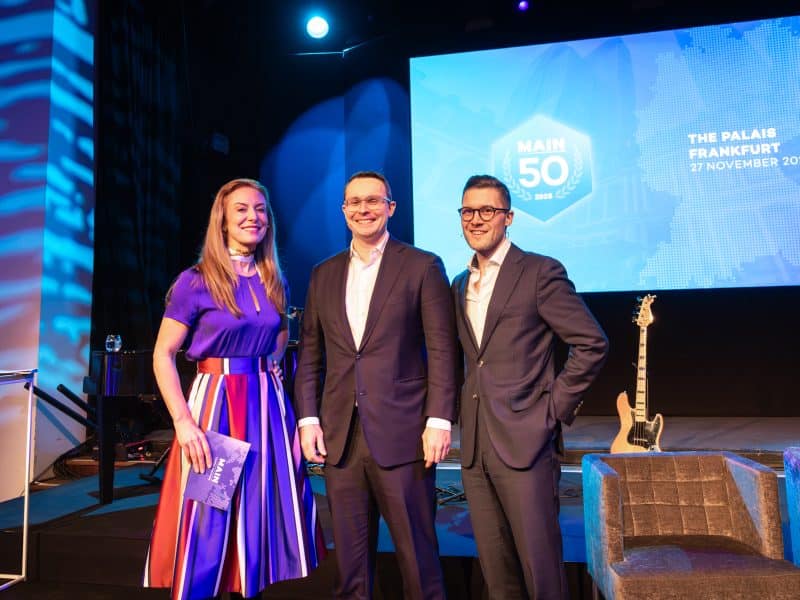
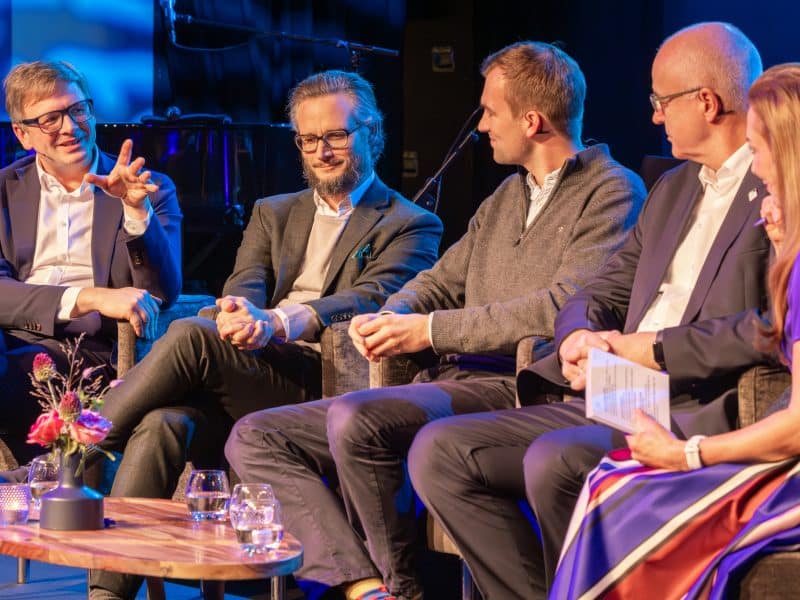
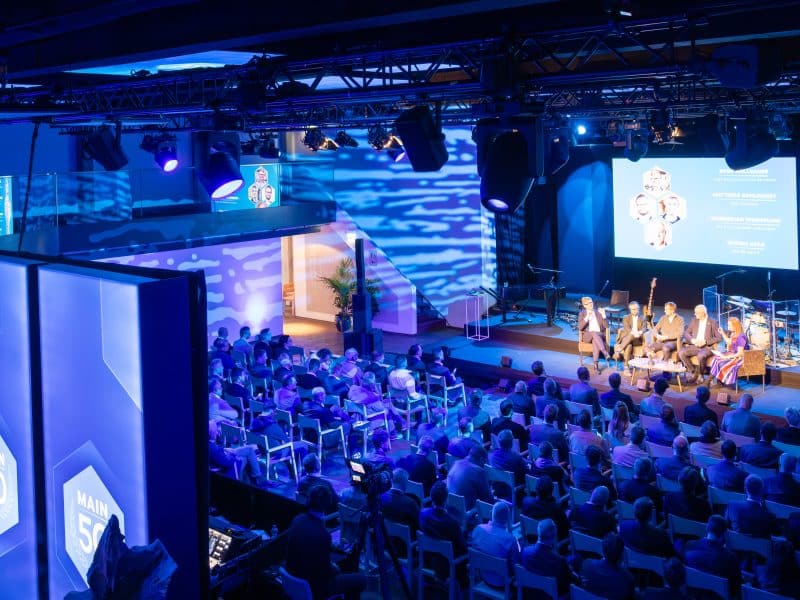
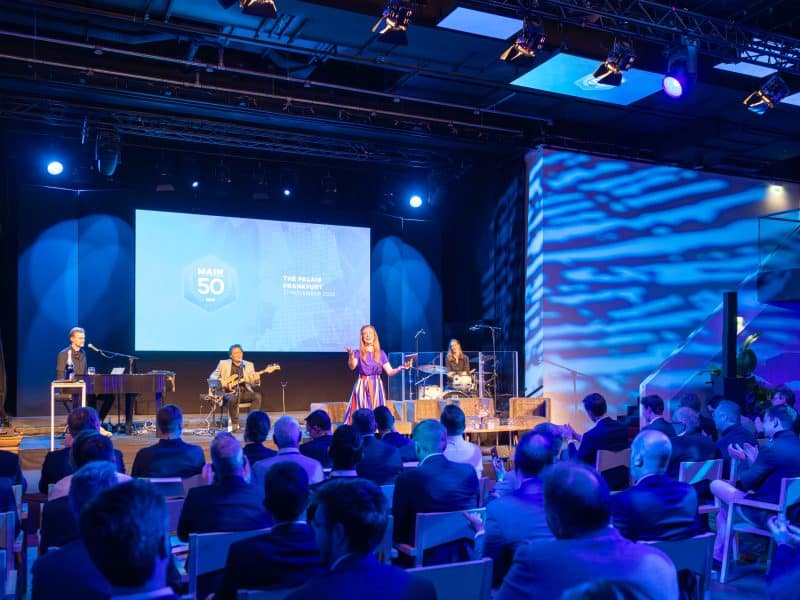
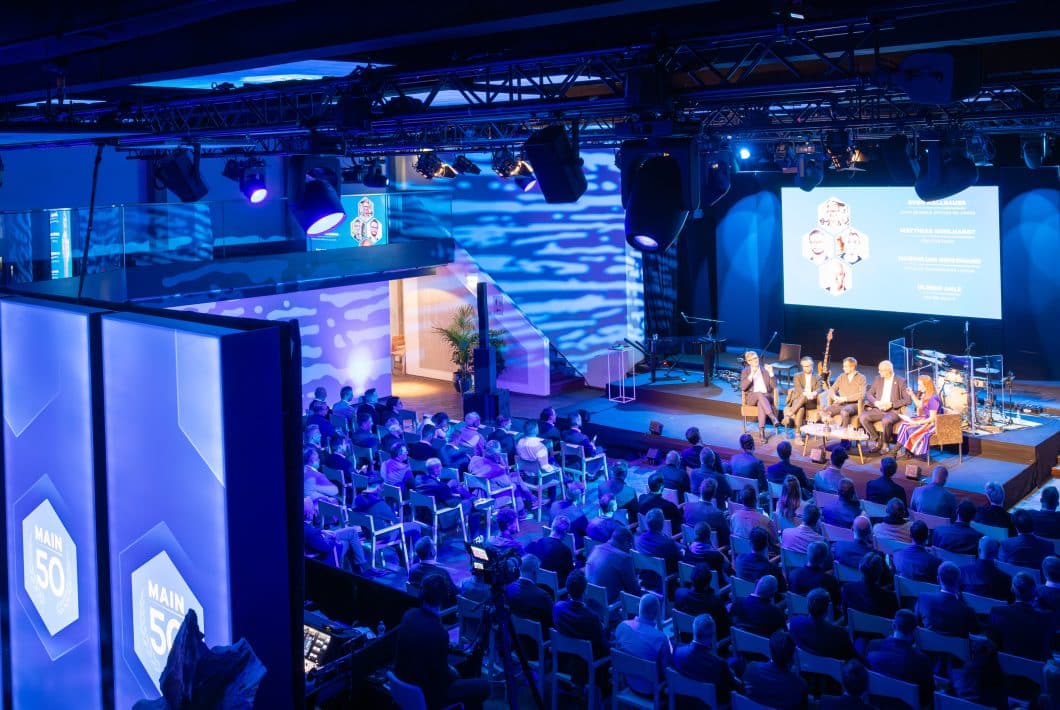
Wir blicken auf eine großartige 4. Ausgabe der Main Software 50 Awards Deutschland zurück, bei der Unternehmer aus der deutschen Softwarebranche im Palais in Frankfurt zusammenkamen, um sich gemeinsam für ihre Erfolge zu feiern. Die Award-Show würdigte die herausragendsten Unternehmen des Rankings. Im Anschluss an die Preisverleihung gab es Gelegenheit zum Netzwerken und zum Austausch von Erfahrungen und Know-how.