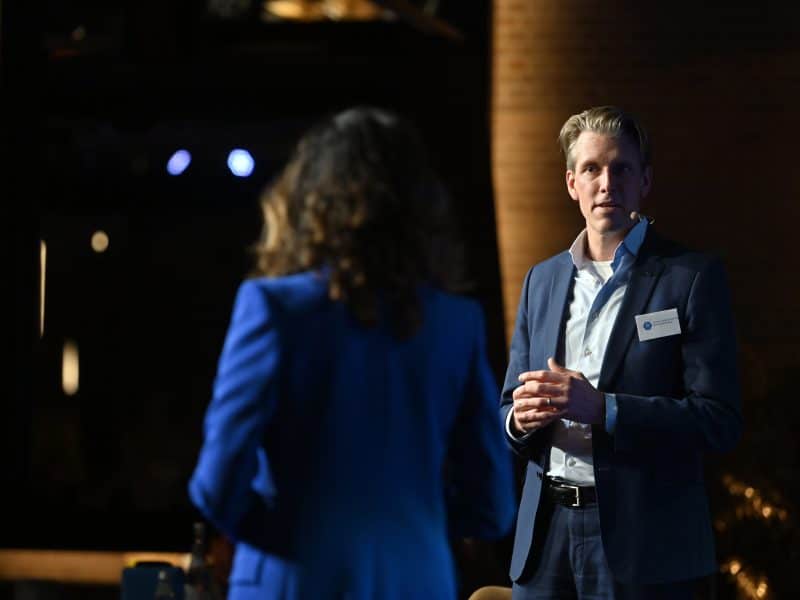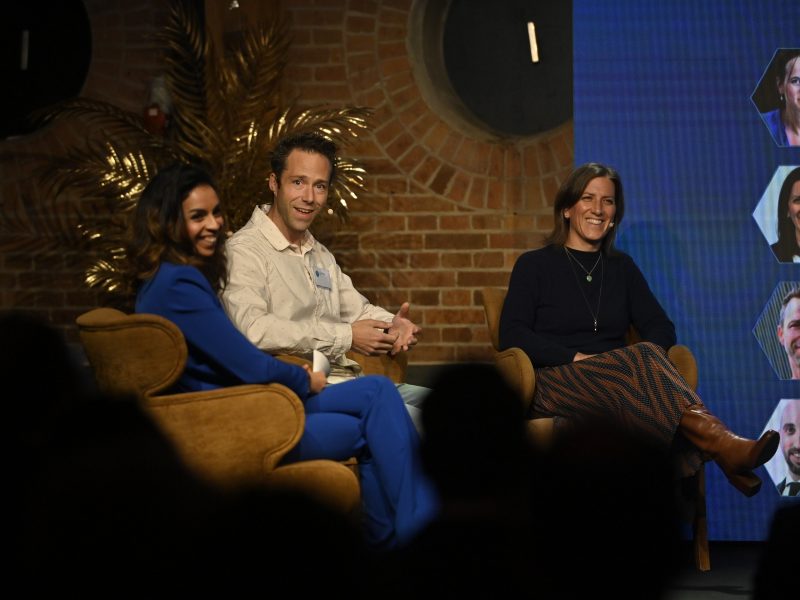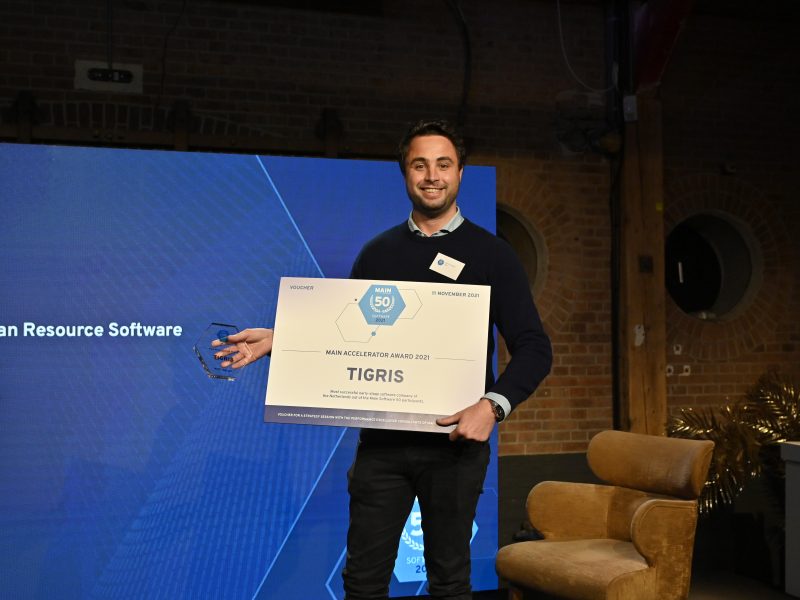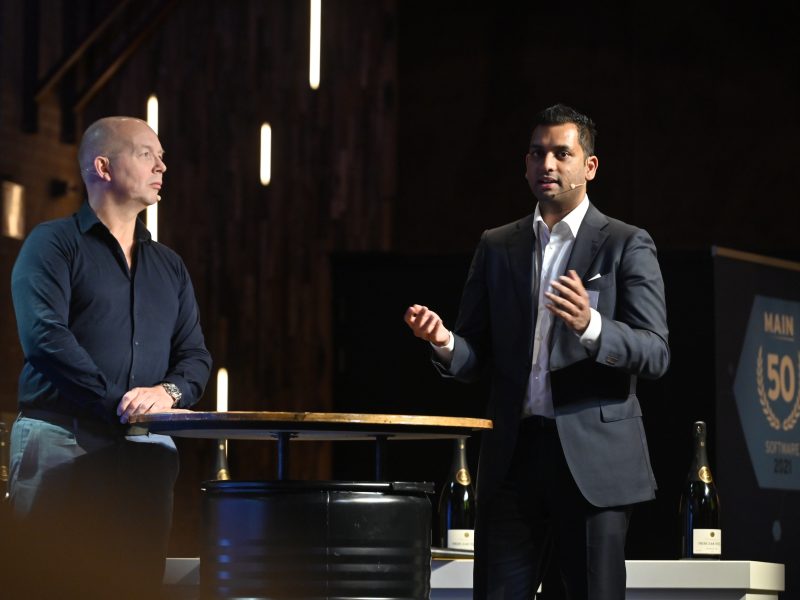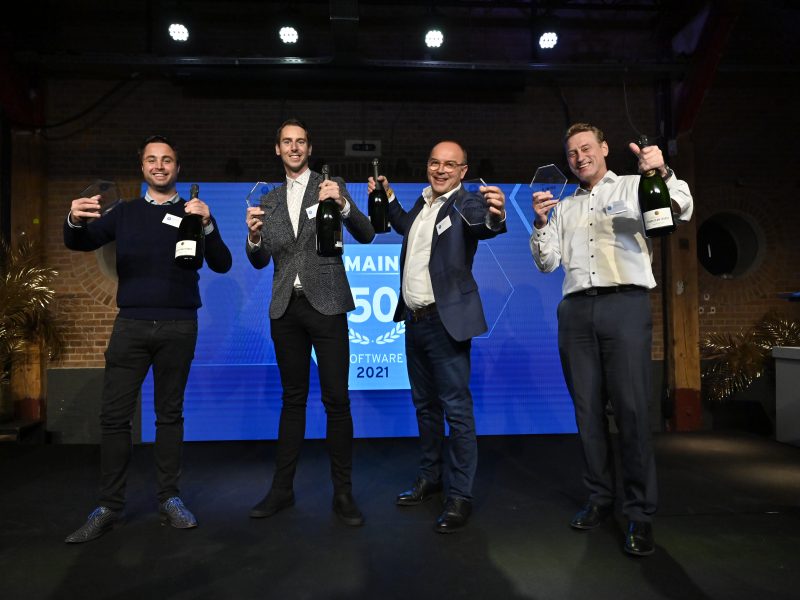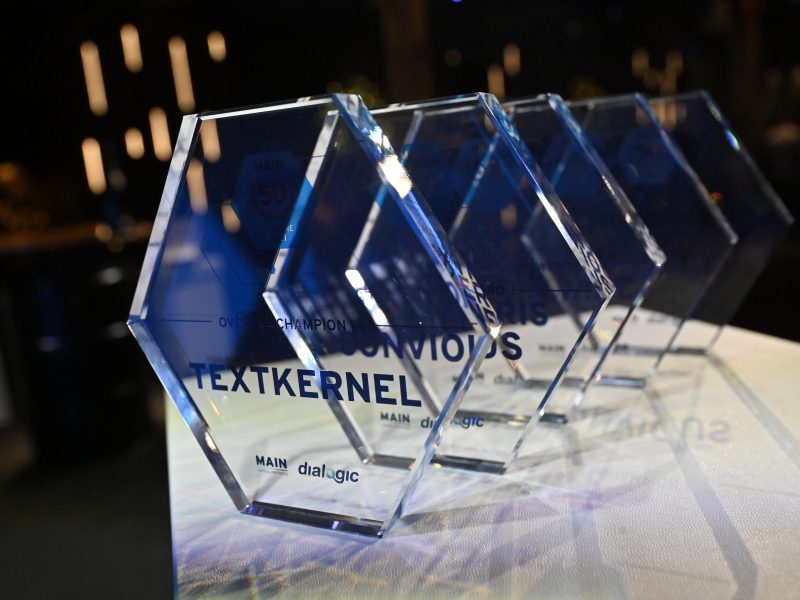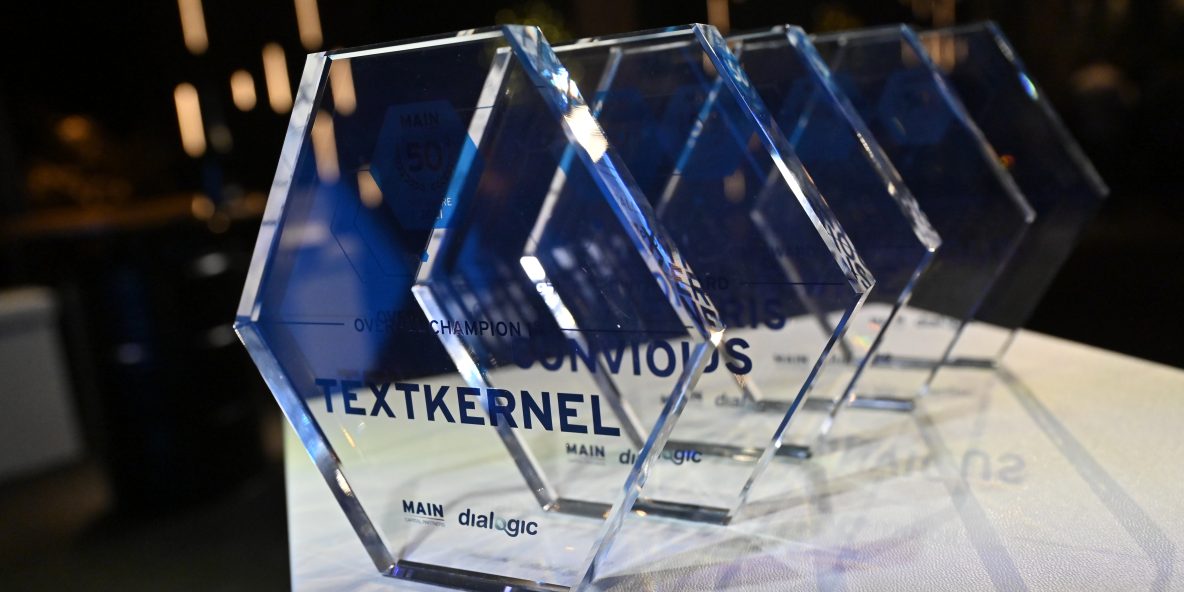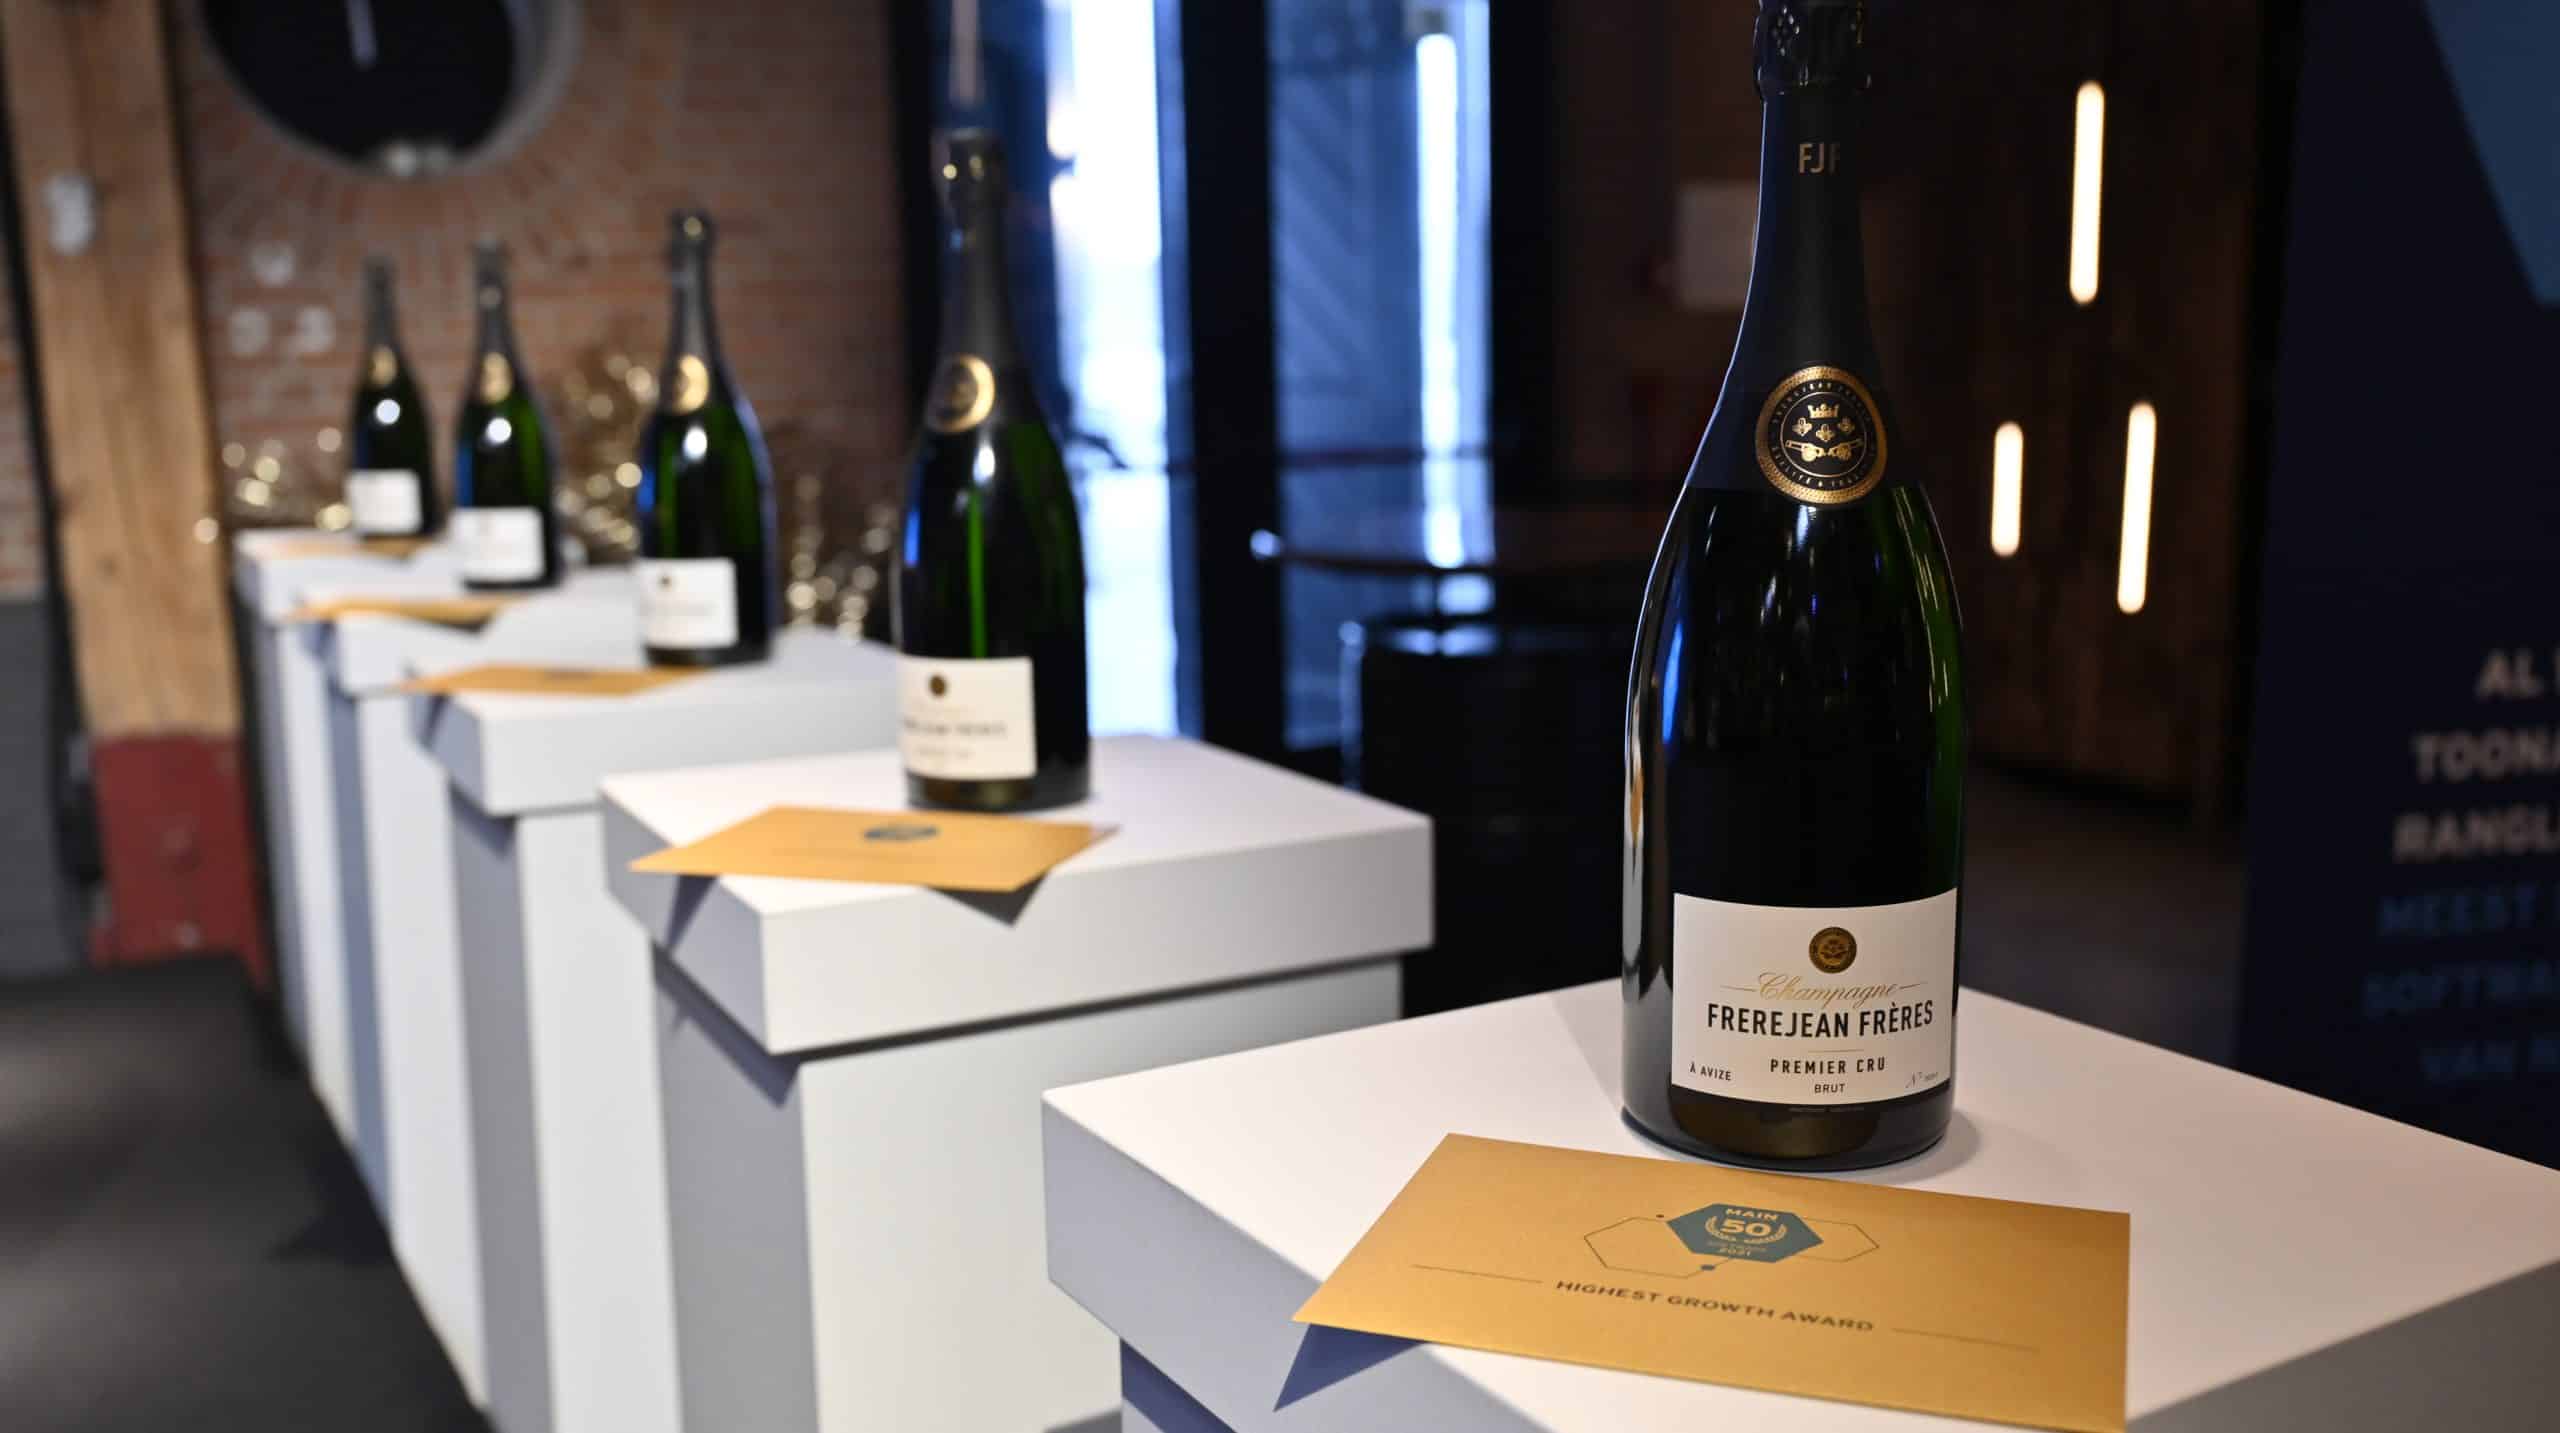
We hadden de eer om Textkernel, Convious en E-WISE te belonen met de Overall Champion Awards. Convious won ook de Highest Growth Award, en de allereerste Main Accelerator Award ging naar Tigris.
| # | Name | Sector |
Winner |
Score |
Founded |
Location |
|---|---|---|---|---|---|---|
| 1 | Textkernel | Human Resource Software | Overall Champion #1 | 100.0 | 2001 | Amsterdam |
| 2 | Convious | E-Commerce Software | Overall Cahmpion #2 and Highest Growth | 98.9 | 2016 | Amsterdam |
| 3 | E-WISE | Education Software | Overall Champion #3 | 98.4 | 1999 | Utrecht |
| 4 | Enovation | Healthcare Software | 97.7 | 1983 | Capelle a/d Ijssel | |
| 5 | RoomRaccoon | Business Intelligence (BI) | 96.4 | 2017 | Breda | |
| 6 | Plauti | Data Quality Software | 96.2 | 2014 | Arnhem | |
| 7 | Cow Hills Retail BV | Omnichannel Retail Software | 95.9 | 2015 | Maarn | |
| 8 | Sana Commerce | E-Commerce Software | 94.8 | 2008 | Rotterdam | |
| 9 | WoodWing | Content Management Software | 93.0 | 2000 | Zaandam | |
| 10 | 12Build | Project Management Software | 92.7 | 2007 | Nijverdal | |
| 11 | Paragin | Education Software | 91.6 | 2000 | Nijkerk | |
| 12 | KING Software | Enterprise Resource Software | 91.1 | 1989 | Heemskerk | |
| 13 | SDB Groep | Healthcare Software | 90.9 | 1976 | Den Haag | |
| 14 | Multibel | Communication Platform Software | 90.7 | 1995 | 's-Hertogenbosch | |
| 15 | OutSmart International | Customer Relationship Management (CRM) | 90.6 | 2012 | Nieuwegein | |
| 16 | Legalsense | Enterprise Resource Planning (ERP) | 90.6 | 2009 | Utrecht | |
| 17 | 4PS | Enterprise Resource Planning (ERP) |
90.5 |
2000 | Ede | |
| 18 | XVR Simulation | Simulation Software | 88.7 | 2000 | Delftq | |
| 19 |
OBI4wan |
Customer Relations Management | 83.6 | 2011 | Zaandam | |
| 20 | Valk Solutions | Omnichannel Retail Software | 88.6 | 1989 | Montfoort | |
| 21 | Gripp | Professional Services Automation (PSA) | 88.2 | 2011 | Tilburg | |
| 22 | AET | Security Software | 87.9 | 1998 | Arnhem | |
| 23 | Codelogic | Dialoque Management Software | 87.9 | 2007 | Beverwijk | |
| 24 |
Appical |
Human Resource Software | 87.6 | 2013 | Amsterdam | |
| 25 | Inergy | Business Intelligence (BI) | 87.6 | 1999 | Woerden | |
| 26 | Reylon | Field Service Management | 87.5 | 2001 | Nootdorp | |
| 27 | Mavin | Business Process Management (BPM) | 87.3 | 1990 | Noordwijk | |
| 28 | SOWISO | Education Software | 87.2 | 2010 | Amsterdam | |
| 29 | Mendrix | Supply Chain Management (SCM) | 86.9 | 2003 | Maarsen | |
| 30 | Nétive VMS | Human Resource Software | 86.6 | 2003 | Rijswijk | |
| 31 | BlueRock Logistics | Supply Chain Management (SCM) | 85.9 | 2013 | 's-Hertogenbosch | |
| 32 | Validata group | Video Management Software (VMS) | 85.5 | 20006 | Hilversum | |
| 33 | GOconnectIT | Geographic Information System (GIS) | 85.3 | 2001 | Nieuwegein | |
| 34 | BrainCreators | Digital Inspection Software | 84.6 | 2016 | Amsterdam | |
| 35 | Sananet Care | Healthcare Software | 84.4 | 1996 | Sittard | |
| 36 | Coachview | Education Software | 83.8 | 2000 | Veghel | |
| 37 | Zens Technologies | Business Intelligence (BI) | 83.7 | 2013 | Amsterdam | |
| 38 | Scan Sys | Business Process Management | 83.3 | 1991 | Nootdorp | |
| 39 | Speakap | Social Software | 82.6 | 2011 | Amsterdam | |
| 40 | FleetGO Group | Telematic Platform | 82.3 | 1991 | Nootdorp | |
| 41 | Vendit | Omnichannrl Retail Software | 81.4 | 1994 | Rotterdam | |
| 42 | Ubeeo | Human Resource Software | 80.5 | 2007 | Rotterdam | |
| 43 | Mployee | Human Resource Software | 80.5 | 2007 | Rotterdam | |
| 44 | Tamigo Nederland | Workforce Management Software | 80.4 | 2014 | Houten | |
| 45 | Zig Websoftware | Real Estate Software | 80.4 | 2007 | Huizen | |
| 46 | FRISS | Fruad, risk, compliance software | 80.4 | 2006 | Utrecht | |
| 47 | Icecat | E-Commerce Software | 79.4 | 1999 | Nieuwegein | |
| 48 | Easygenerator | Education Softwareq | 79.4 | 2013 | Rotterdam | |
| 49 | Validata group | Huaman Resource Software | 79.3 | 2009 | Amsterdam | |
| 50 | Trengo | Omnichannel Communication Platform | 79.2 | 2015 | Utrecht |
Hoewel de samenstelling van de ranglijst elk jaar verandert, is er een duidelijke trend zichtbaar met betrekking tot de terugkerende omzet en EBITDA. Door de jaren heen zien we een gestage toename van de terugkerende omzet. In de editie van 2021 is 75% van de omzet terugkerend, tegenover slechts 54% in 2012. Ook zien we in de Main Software 50 al tien jaar een toename van het aandeel bedrijven met een hoge winstmarge (meer dan 10%). In de editie van 2021 behaalde 78% van de Main Software 50-bedrijven een EBITDA van meer dan 10%, terwijl dat tien jaar geleden nog maar 50% was.
Met een stijging van de omzet, de winst, het personeelsbestand en de productiviteit in 2020 lijkt de covidepandemie weinig impact te hebben gehad op softwarebedrijven. We zien echter wel lagere investeringen in R&D in 2020. 82% van de bedrijven besteedde meer dan 10% van de omzet aan R&D, tegenover 92% het jaar ervoor. We zien ook dat het vertrouwen in toekomstige omzetgroei is teruggekeerd naar hetzelfde niveau als voor Corona: dit jaar verwacht 58% van de bedrijven een groei van meer dan 20%. Vorig jaar was dit nog 42%.
Ongeveer 30% van de totale omzet wordt in het buitenland gegenereerd: 21% wordt binnen Europa verzameld, 9% in de rest van de wereld. De internationale verkoop neemt al enkele jaren gestaag toe. In 2012 bedroeg deze nog maar 19%. Dit toont de toenemende internationale schaalbaarheid van Nederlandse softwarebedrijven.
Het totale aantal FTE’s aan het einde van 2020 was 3.262. Dit betekent een stijging van 16% in het aantal werknemers van de Main Software 50-bedrijven over het jaar 2020. De omzet per FTE bedroeg gemiddeld EUR 126.000 en steeg in 2020 met 6% ten opzichte van 2019. Interessant is dat de productiviteit van de Main Software 50-bedrijven met ongeveer 20% is gestegen sinds de eerste meting in 2012.
De kerncijfers voor editie 2021 zijn gebaseerd op gegevens van de Main Software 50-bedrijven voor het boekjaar 2020. De totale omzet van de 50 bedrijven in de ranglijst steeg zelfs tijdens de pandemie. De totale omzet aan het einde van het boekjaar 2020 bedroeg 409,8 miljoen euro, wat een stijging van 23% betekent ten opzichte van de omzet die de bedrijven aan het einde van 2019 boekten.